Quarq
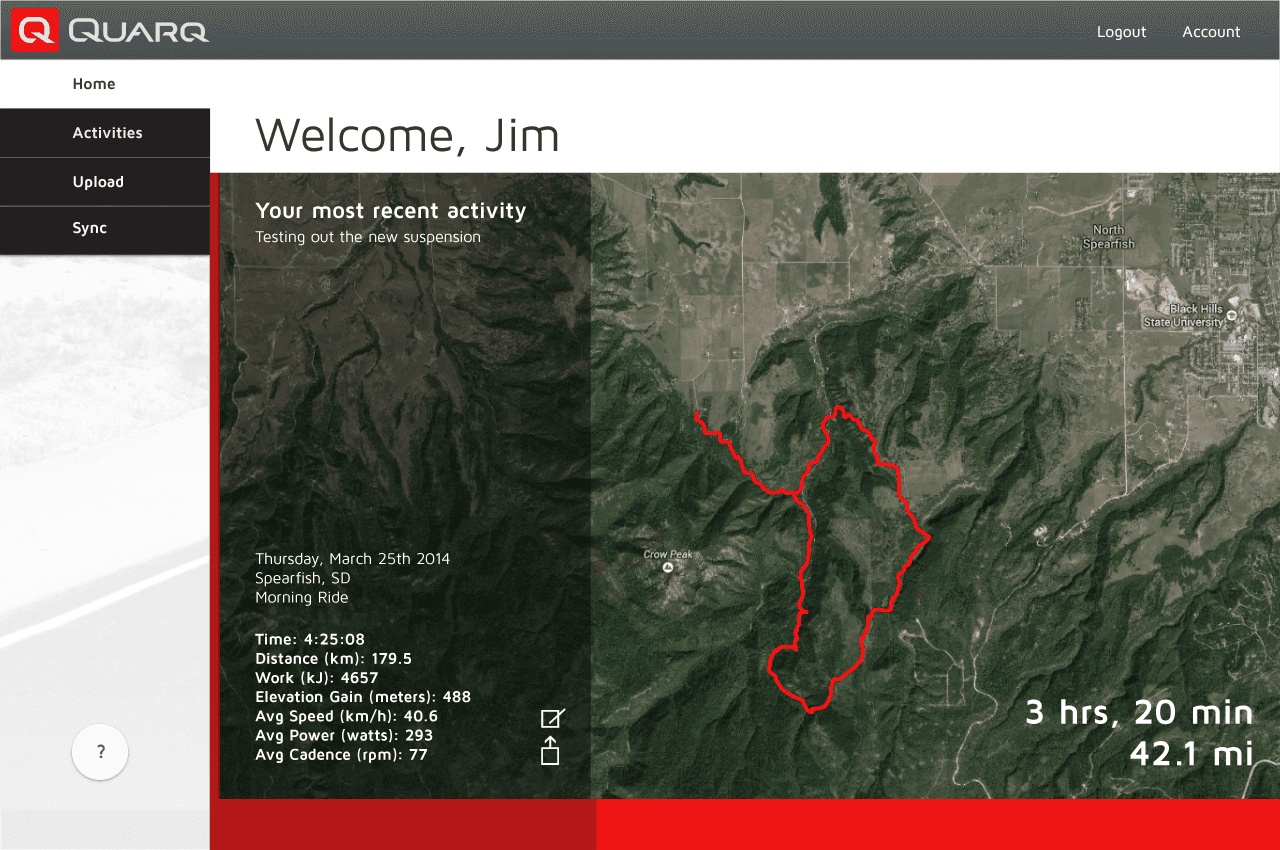
A global leader in cycling power meters, Quarq was ready to bring its on-device data online. To make this happen, they needed to work with a designer and developer who could create an interface that allowed cyclists to view and share their data while accounting for the rugged terrain and extreme lengths of the IRONMAN World Championship.
Service
Website design, Design system, Icons
Sector
Climate & Enviroment
Year
2024
Problem to Be Solved
Quarq manufactured devices that measured the power cyclists created during their rides. Their data was accurate down to a fraction of a second, but couldn’t be accessed until a rider dismounted and plugged a reader into the device located in the crank arms of their bike pedals. This wasn’t ideal for competitive riders who craved up-to-the-second data they could view and share throughout their ride. Riders who made up a large portion of the Quarq customer base. To support them, the company turned to Exosite looking for an interface that could translate device data into a real-time interface that fueled competition and device sales.
Project Goals and Challenges
Debut to global viewership during IRONMAN World Championship
Accommodate data visualization needs of both racers and sportscasters
Translate to daily, casual use beyond race day
Track racer progress throughout each leg of the triathlon — not just the ride
Go from concept to demo to full functionality in 40 days
My Role
Brought on to the Exosite team for a combination of front-end development and design capabilities — skills previously absent from the company’s otherwise impeccable roster — I became the sole resource on the project.
Throughout the process, I would leverage every inch of my UX expertise, web design portfolio, client management experience and responsive front-end development toolbox to create the platform.
The Process
Given the timeline we wasted no time, diving into user interviews to uncover their priorities in purchasing an athletic tracker. Combining these learnings with what we understood about the needs of sportscasters who would be calling the race, we started with a low-res of the site.
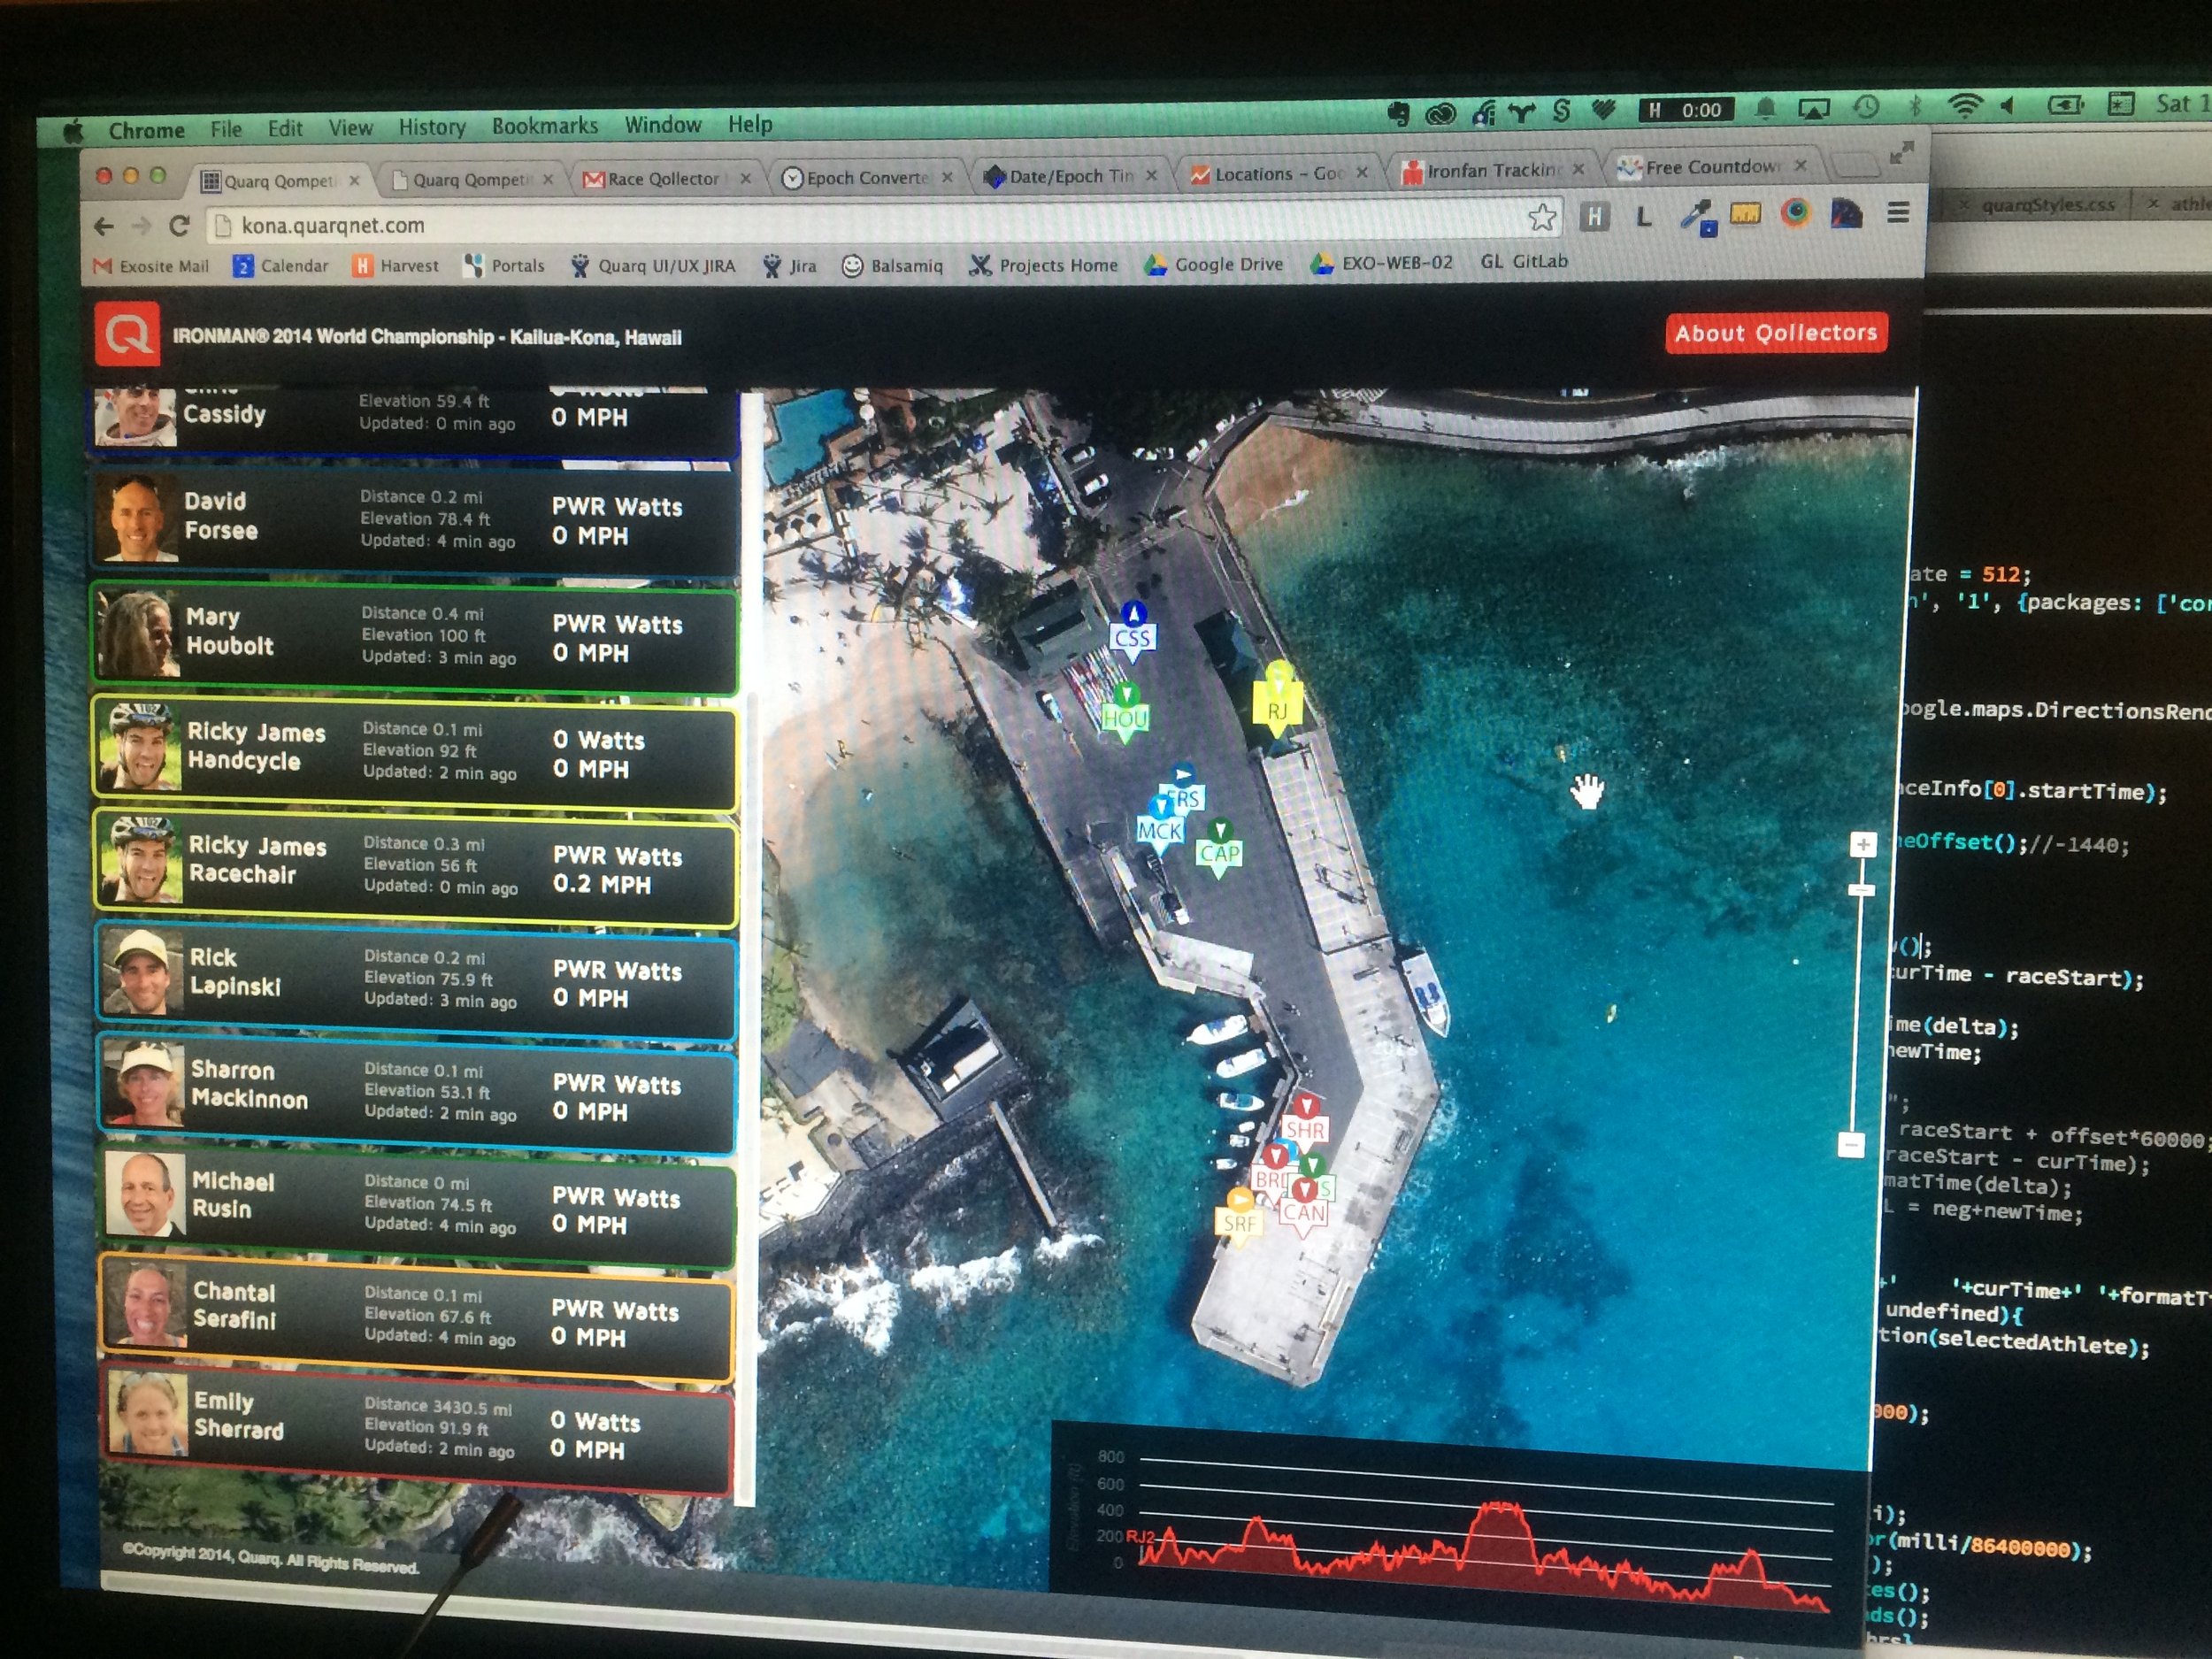
We tested both the rider interface as well as the visualization race organizers would use to monitor the progress of athletes throughout the race. In this testing we found the circuitous track combined with reporting frequency, adjusted to extend battery life, compromised some of our data, including the ascent and the all-important racer position
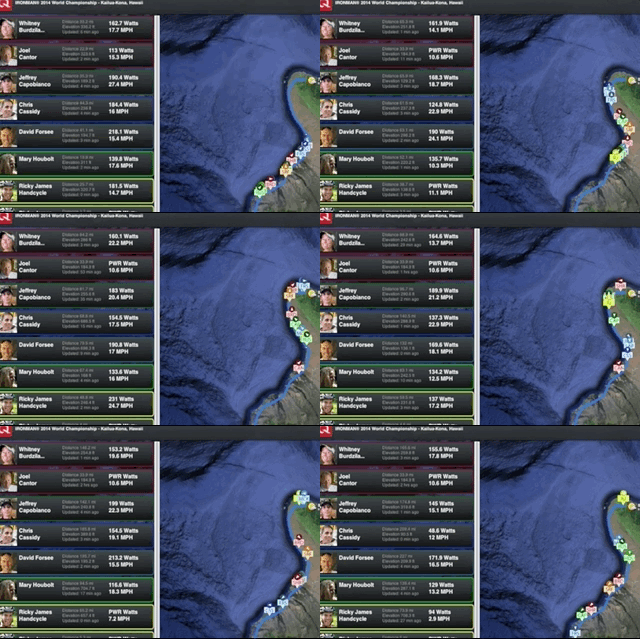
We overcame this challenge by mapping athlete positions to known coordinates along the route. This allowed us to accurately report both ascent stats and rider rankings throughout the 6- to 20-hour race.
Results
MORE PROJECTS


